
1. Phoenix, AZ

Phoenix is the poster child for pandemic-era growth that finally hit a wall. Prices surged fast when remote workers poured in, but higher mortgage rates exposed how stretched affordability had become. Inventory has climbed compared to 2021, giving buyers more leverage than they’ve had in years. It’s a reminder that Sun Belt momentum isn’t infinite.
At the same time, Phoenix hasn’t collapsed, which is the interesting part. Population growth and job creation haven’t stopped, they’ve just normalized. Builders are still active, but they’re offering incentives instead of bidding wars. The split here is between overheated expectations and a more boring, sustainable market.
2. Austin, TX

Austin’s housing market is a reality check wrapped in a tech hoodie. Prices ran up aggressively as tech workers arrived, then cooled faster than many expected. Some neighborhoods have seen meaningful price declines from their peaks. That makes Austin a clear example of how fast-growth markets can reverse.
Yet Austin isn’t suddenly cheap or undesirable. The job base is still strong, and long-term demand hasn’t disappeared. What’s changed is buyer psychology, with fewer panic offers and more negotiation. The city now sits in an awkward middle ground between boomtown and value market.
3. Tampa Bay, FL

Tampa Bay looked unstoppable during the remote-work surge. In-migration from the Northeast and Midwest pushed prices and rents sharply higher. Recently, rising insurance costs and property taxes have started to bite. That’s cooled demand in ways many buyers didn’t anticipate.
This isn’t a crash story, but it is a friction story. Owning in Florida now comes with costs beyond the mortgage, and buyers are factoring that in. Sellers can no longer assume instant offers above ask. The split here is between lifestyle appeal and the true cost of ownership.
4. Boise, ID

Boise went from sleepy to sizzling almost overnight. Prices jumped dramatically as buyers fled more expensive West Coast metros. Once rates rose, that affordability math stopped working. Boise saw one of the sharper corrections among pandemic boom markets.
Still, Boise isn’t reverting to its old self. Prices remain well above pre-2020 levels, and supply is still relatively tight. Locals and newcomers are now competing on more equal footing. It’s a market learning how to exhale after holding its breath too long.
5. Las Vegas, NV

Las Vegas has always been sensitive to economic mood swings. Investor activity played a big role in its recent housing run-up. As financing costs increased, some of that investor demand pulled back. That shift has had an outsized impact on inventory.
Owner-occupant demand hasn’t vanished, though. Job growth tied to tourism, sports, and entertainment continues. What’s changed is the balance between speculation and fundamentals. Las Vegas is once again proving it amplifies both upswings and slowdowns.
6. Salt Lake City, UT

Salt Lake City doesn’t get as much attention, but it should. Strong job growth and limited land have kept pressure on prices. Even with higher rates, supply constraints remain a real issue. That has prevented the kind of pullback seen elsewhere.
At the same time, buyers are more cautious than they were two years ago. Homes take longer to sell, and price cuts are more common. The market is splitting between prime locations and fringe suburbs. In Salt Lake City, location has started to matter more than momentum.
7. Miami, FL
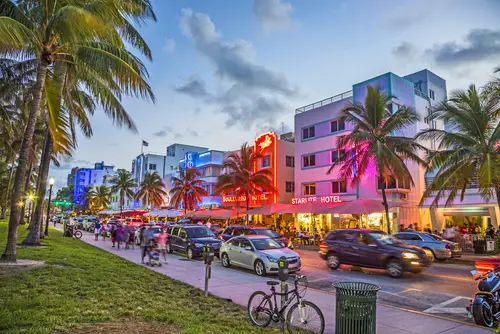
Miami’s market feels like it’s playing by different rules. Luxury and high-end properties continue to attract domestic and international buyers. Cash purchases are more common here, muting the impact of higher mortgage rates. That has kept prices resilient.
But the story changes as you move down the price ladder. Middle-income buyers are struggling with affordability and insurance costs. Some are being priced out entirely or pushed farther inland. Miami’s split is increasingly about who can pay cash and who cannot.
8. New York City, NY
New York City was declared “over” more times than anyone can count. Yet demand for housing, especially rentals, roared back. Sales are slower due to rates, but prices haven’t fallen dramatically. Scarcity and income density still matter here.
The split shows up by property type and neighborhood. Co-ops face more resistance, while well-located condos hold value better. Outer-borough and suburban dynamics differ sharply from Manhattan. New York remains expensive, just in a more selective way.
9. San Francisco Bay Area, CA
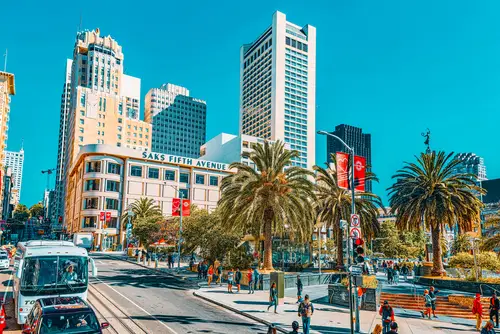
The Bay Area is often lumped into a single narrative, but it’s deeply fractured. Tech layoffs and remote work hit San Francisco hardest. Condo demand weakened, and prices softened in urban cores. That fueled the perception of a broad collapse.
Zoom out, and the picture changes. Single-family homes in top school districts remain highly competitive. Limited supply continues to support prices in much of Silicon Valley. The Bay Area’s split is less about decline and more about uneven recovery.
10. Inland Empire, CA
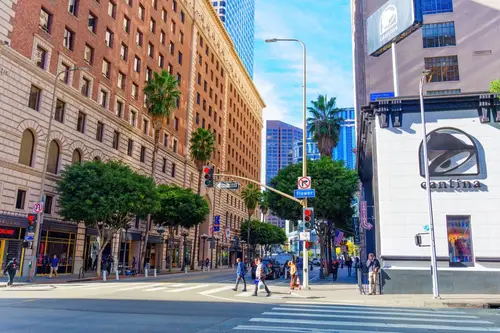
The Inland Empire has long been Southern California’s pressure valve. Buyers priced out of Los Angeles and Orange County looked east for relief. That pushed prices up quickly during the pandemic. Now, higher rates are testing just how far that affordability stretched.
Long commutes and rising transportation costs are part of the equation again. Demand hasn’t disappeared, but it’s more price-sensitive. Builders are adjusting by slowing projects or offering incentives. The region shows how affordability-only markets can be fragile.
11. Detroit, MI
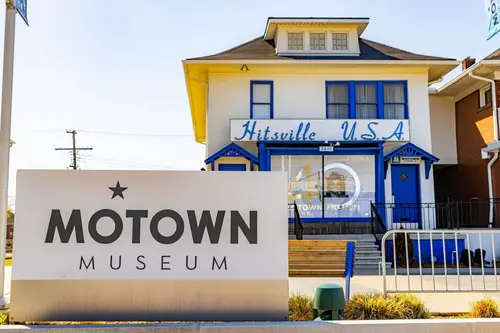
Detroit doesn’t usually headline housing boom stories, but that’s changing quietly. Prices remain low relative to national averages. That has insulated the market from rate shocks. Buyers can still find monthly payments that make sense.
Investment and redevelopment are also playing a role. Certain neighborhoods are seeing real momentum tied to jobs and infrastructure. Not every area is benefiting equally, which is important to note. Detroit’s split is between revival pockets and places still waiting.
12. Providence, RI

Providence is a classic spillover market done right. As Boston became prohibitively expensive, buyers looked south. That steady, not explosive, demand lifted prices. The market feels tight but not frantic.
Inventory remains limited, supporting values even as rates stay high. Buyers are more deliberate, but they’re still showing up. Providence benefits from proximity without full dependence. It’s a reminder that secondary cities can outperform quietly.
13. Greenville–Spartanburg, SC

This Upstate South Carolina region has been humming under the radar. Manufacturing and logistics jobs have attracted steady population growth. Housing demand followed, but without the extreme spikes seen elsewhere. That balance has mattered.
Prices have risen, but affordability is still reasonable. Builders are active, keeping supply flowing. The market feels resilient rather than speculative. Greenville–Spartanburg shows how job-driven growth can create stability.
14. Minneapolis–St. Paul, MN

The Twin Cities represent a Midwest market with surprising strength. Diverse employment and higher household incomes support demand. Price growth has been more measured than coastal markets. That moderation has helped maintain balance.
Inventory constraints are still an issue, especially in popular suburbs. Buyers face competition, but not chaos. The market hasn’t whipsawed with national sentiment. Minneapolis–St. Paul highlights how boring can actually be a compliment in housing.
This post The U.S. Housing Map Is Splitting — And It’s Not Where You Think was first published on Greenhouse Black.